
In late August, headlines across financial news media read along the lines of “This is now the longest bull market in history!” While there is some argument around what defines a bull market, whether a large-cap or all-cap index should be observed, and other technicalities including Price Return versus Total Return (which includes dividends), it is safe to say that the market’s run since the Global Financial Crisis has been among the longest bull markets in history.
The U.S. economy continues to hum along. Corporate earnings remain robust, consumer spending is healthy and a tight labor market is supporting inflation, which is hitting the Federal Reserve’s target of 2%. Within the stock market, strong performance in a few narrow areas have largely driven the returns of popular indices such as the S&P 500.
“Market breadth” is a measurement of how many stocks rose versus how many stocks declined over a given time frame. The story for much of 2018 has been how the market has continued to hit new highs despite low market breadth. In other words, a small concentration of stocks have made outsized contributions to the overall stock market’s return, enabling it to continue grinding higher despite subdued returns from many of its constituents.
The small basket of stocks that received most of the credit for powering the market higher until its recent selloff was the FAANG group (Facebook, Apple, Amazon, Netflix and Alphabet’s Google). Revenue from internet-related services contribute to all four FAANG companies (despite Amazon being a consumer company, its AWS cloud-computing division contributes over 10% of its revenues and growing). Their year-to-date performance through mid-July was staggering as illustrated by the graph below.
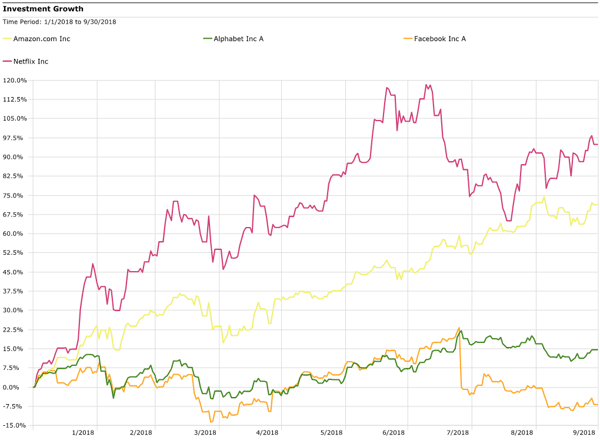
Source: Morningstar Direct
However, since mid-July, the high-flying FAANG names have underperformed as investors questioned whether earnings could be peaking.
So investors have shifted toward another strong-performing sector that has been contributing the most toward S&P 500 returns: the health care sector1. Health care’s market leadership has resulted in a rebound in market breadth, which is comforting to see since now there are a wider range of stocks driving the market higher.
In the graph below, the health care sector, represented by the S&P Health Care Select Sector, is shown outperforming the S&P 500 Index since July.
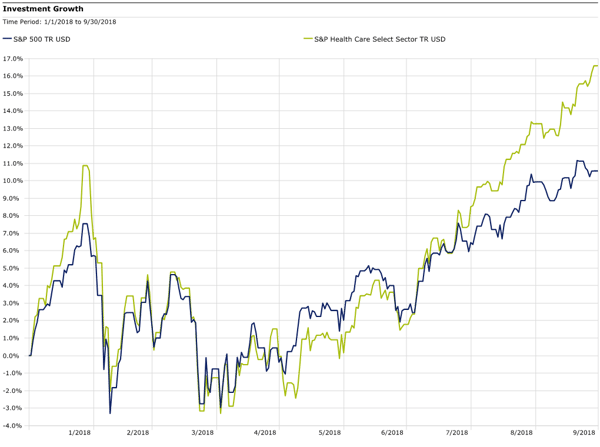
Source: Morningstar Direct
While health care stocks’ strong performance is likely driven in part by mutual fund and hedge fund managers allocating more capital to the space, fundamentals have been strong as well, as tax reform has boosted revenues. It is yet to be seen if the pharmaceutical, biotechnology and health care service providers that have been behind the health care rally can generate sustained outperformance, or whether the strong organic growth of technology companies could result in them regaining market leadership. In the event that the U.S. economy cools off, or the market declines for other reasons, health care stocks are traditionally less cyclical than tech stocks, since patients will continue to need services and drugs regardless of economic conditions. This could bode well for the health care sector’s relative performance going forward.

1As measured by Goldman Sachs Group Inc.
Dana Large Cap Equity Fund top-ten holdings as of September 30, 2018: Apple Inc. (2.48%), Pfizer Inc. (2.36%), Amgen Inc. (2.21%), WellCare Health Plans, Inc. (2.18%), UnitedHealth Group Inc. (2.15%), Stryker Corporation (2.12%), Alphabet Inc. Class A (2.10%), Microsoft Corporation (2.10%), Bristol-Myers Squibb (2.05%), Johnson & Johnson (2.03%).
Dana Small Cap Equity Fund top-ten holdings as of September 30, 2018: Universal Insurance Holdings, Inc. (2.34%), Bottomline Technologies, Inc. (2.14%), Ligand Pharmaceuticals, Inc. (2.05%), Marcus Corporation (2.03%), Emergent BioSolutions Inc. (2.00%), Primerica, Inc. (1.99%), Boot Barn Holdings, Inc. (1.98%), BioTelemetry Inc. (1.87%), Chefs' Warehouse, Inc (1.83%), Comfort Systems USA, Inc. (1.83%).