[Chart of the Month] The Market is Roughly Flat Over Past 12 Months
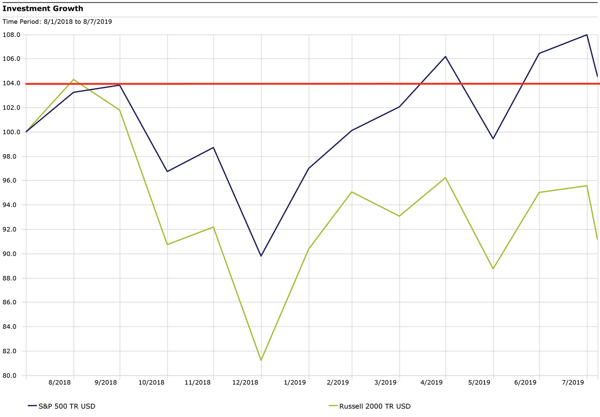
What a ride it’s been. It’s hard to believe that after the fourth quarter’s selloff, the first quarter’s rebound and the recent spike in volatility, the S&P 500 is back to the mid-$2,900 level it was at nearly a year ago.
Small cap stocks, however, are a different story. While TV anchors had been opining on large caps hitting all-time highs, it was easy to overlook the fact that small caps (Russell 2000 Index) never got close to reclaiming levels reached in August of last year.
S&P 500 and Russell 2000 Indices
8/1/18 - 8/7/19
SOURCE: Morningstar Direct
The disconnect between large- and small-cap stocks’ performance can partially be tied to concerns over slowing U.S. economic growth, which tend to disproportionately affect small caps since they are more domestically focused. Investors have also been concerned over the U.S.-China trade war resulting in higher input costs for small-cap companies. Currently, however, small caps present an intriguing value play relative to large caps, since they have effectively gone on sale.
If you would like to be notified when we release new market insights, please fill out the form on the right, "Stay up to date with current market trends," and we will send you an email.


