
Value stocks have quietly made a bit of a comeback in recent weeks, due in part to positive news on coronavirus vaccines, which could hold the key to opening the economy and helping many of the cyclical businesses in value indices. If this is the sign of a new turn for value, it was a long time coming.
The charts below offer perspective on just how wide the gulf between value and growth stocks has become. While we won’t try to predict whether a recent bounce by value stocks – the Russell 3000 Value Index outperformed the Russell 3000 Growth by more than 600 basis points the week ending 11/13 – we believe the wide delta in performance and valuation suggests an attractive entry point for value stocks, and a potentially long run for the investment style when it returns to favor.
See below, for insight into how much value stocks have been out of favor:
Valuation Bifurcation
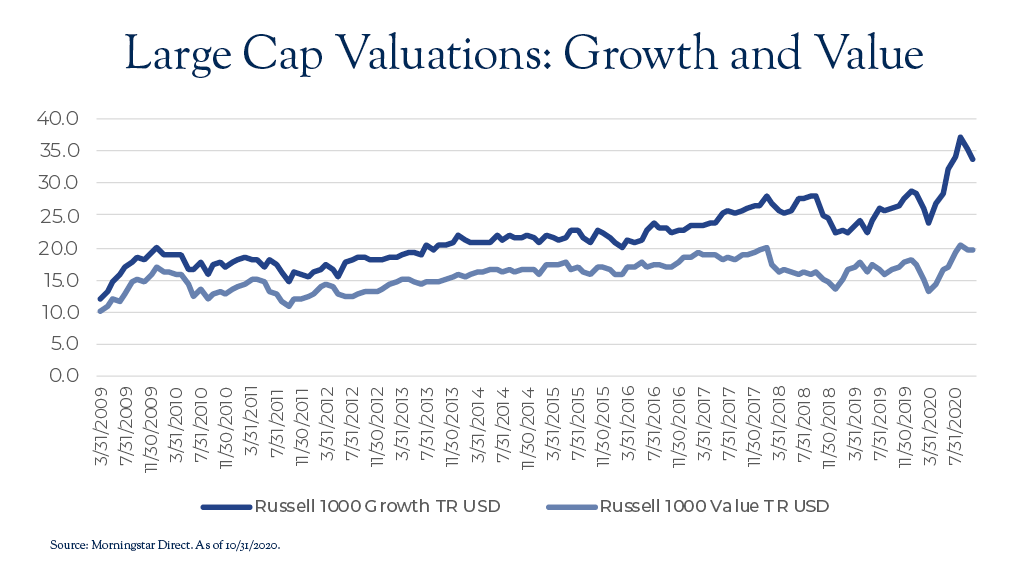
The first chart compares the trailing P/E of the Russell 1000 Growth and Value Indices. The valuation difference has widened since the pandemic, and sits near its largest difference since at least 2009.
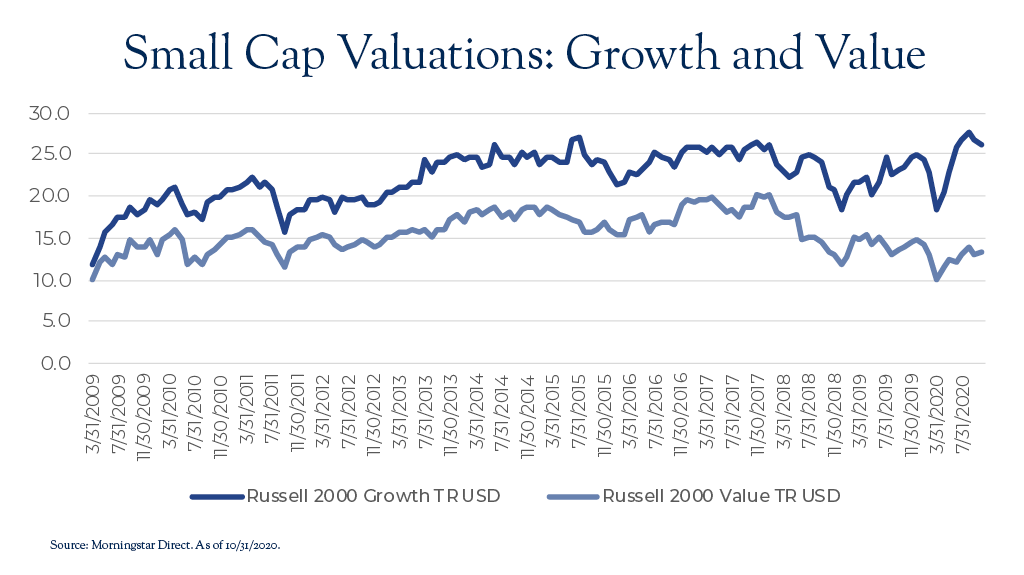
The second chart looks at small caps, comparing valuations for the Russell 2000 Growth and Russell 2000 Value Indices. It shows one of the largest valuation gaps between growth and value in recent memory.
Perspective on Performance
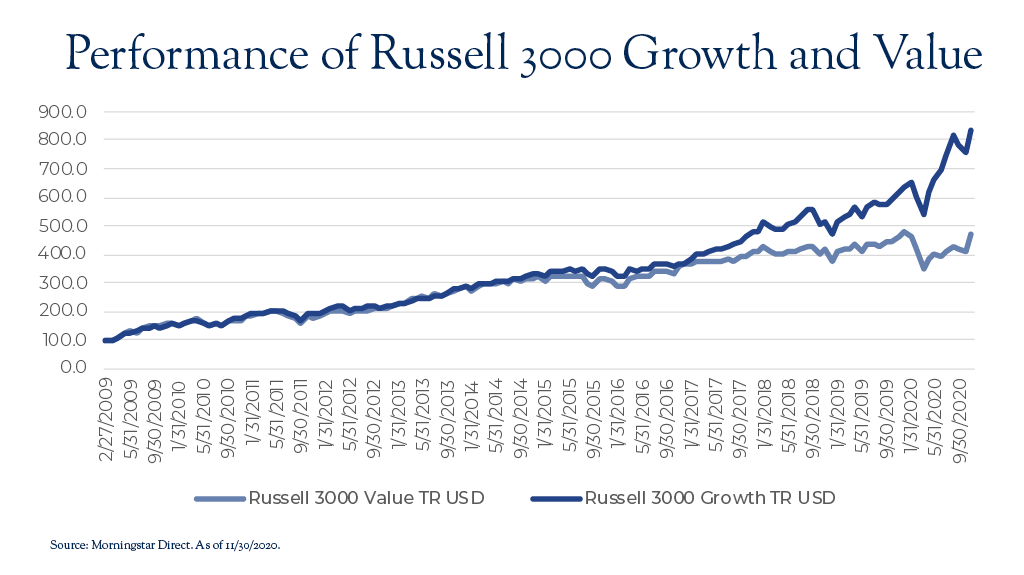
The third chart puts more perspective on the different fortunes of value and growth stocks in recent years, comparing the performance of the Russell 3000 Growth and Value indices, while the table below it shows the performance over different time periods. Not surprisingly, growth has won big.
.png)
Bottom Line: Be Prepared for a Comeback
Dana’s strategies are core portfolios. We seek stocks that have both value and growth characteristics. This means we prefer stocks whose revenue and cash flow stair step upwards over time … but where the investor hasn’t overpaid for them.
The inclusion of stocks from both camps has led to a value bias in our portfolios. That bias has hurt relative performance at times recently, as mega-cap technology stocks fueled much of the S&P 500’s rise this year, and made the index more concentrated and top-heavy than at any point in decades. (For more perspective, read this blog.)
But we believe the S&P 500’s over-exposure to mega-cap growth stocks could be dangerous for passive investors if value investing returns to favor. As the charts above show, that return is probably overdue.
Unmanaged index returns do not reflect any fees, expenses or sales charges.