
While everyone was busy talking about FAANG stocks driving the market higher this year, small caps were flying even higher, outperforming large caps by over 5% throughout most of the summer. However, as investor sentiment cooled and volatility returned in a big way, “risky” assets like small caps have taken it on the chin.
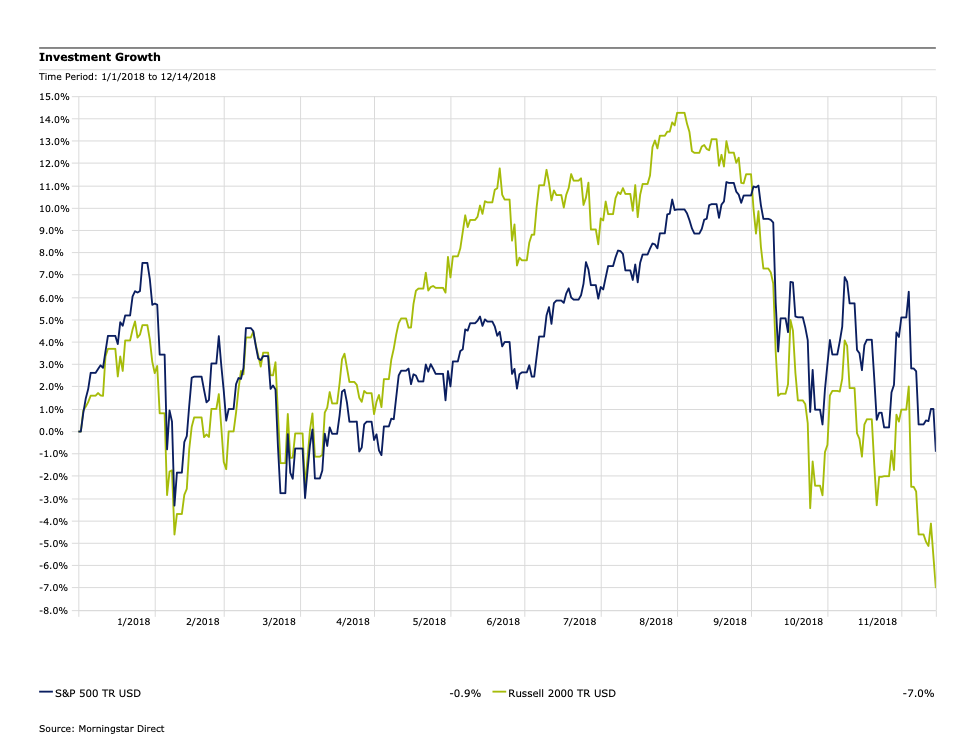
Names like Facebook, Apple, Amazon, Netflix and Alphabet dominated headlines for much of 2018, as did other high-growth large-cap companies like Tesla. Many investors were concerned over the low market breadth, meaning the small concentration of stocks moving the overall market higher. Meanwhile, as illustrated by the graph above, small cap stocks (Russell 2000 Index) were on a tear and probably didn’t get the attention they deserved.
There were a few factors driving the small cap rally. The superior sales and growth rates for smaller cap companies were primary drivers, with further earnings tailwinds coming from tax-cuts. The economy was also growing at a fast clip, interest rates were relatively lower, and there was strong demand for risk assets such as small cap stocks.
As concerns over trade wars and tariffs increased, the typically-domestic footprint of small caps also became attractive for many investors. Whereas large cap companies tend to be multinational, with increased exposure to geopolitical turmoil, small cap companies tend to be much more U.S.-focused, often competing in particular geographies within the country. Similarly, many investors were betting the U.S. economy would continue to grow at a faster rate than other developed countries and preferred small caps’ direct U.S. exposure.
That all changed in September. Small caps began a decline that accelerated rapidly in early October, as shown by the graph. On October 3rd, Fed Chairman Jerome Powell announced that “we are a long way from neutral,” meaning further rate increases would be needed. Investors, nervous over the potential for the Fed to raise rates too far and cause a recession, began unloading risk asset classes like small-cap stocks and high-yield bonds. Investors also began covering their short positions of U.S. Treasury note futures - a very popular trade this year - which amplified the risk-off mindset in the equity market.
Despite the bearish sentiment, earnings season was largely positive. This illustrates the disconnect between strong equity fundamentals and the risk-off sentiment. Much of the bearishness continues to be driven by the bond market, as lower U.S. Treasury yields have affected the shape of the yield curve. Rates from 3-10 years have fallen and the talk of yield curve inversion - a predictor of recessionary liquidity conditions - increased considerably although corporate earnings are still quite strong.
Since the beginning of December, small cap volatility has been exacerbated by media pundits’ continued chatter over a potential recession. While these concerns are likely overblown, you should find comfort in the fact that over long time periods (across market cycles), small caps have generated stronger returns than large caps, and we believe that likely isn’t going to change going forward. Further, if conditions do wind up deteriorating, high-quality companies such as the ones we invest in tend to take market share from competitors during tough economic times and emerge even stronger during the next cycle. Lastly, a market repricing event, like what we are experiencing now, allows asset managers to upgrade some holdings at lower prices, since prices are effectively going on sale.

Dana Large Cap Equity Fund top-ten holdings as of September 30, 2018: Apple Inc. (2.48%), Pfizer Inc. (2.36%), Amgen Inc. (2.21%), WellCare Health Plans, Inc. (2.18%), UnitedHealth Group Inc. (2.15%), Stryker Corporation (2.12%), Alphabet Inc. Class A (2.10%), Microsoft Corporation (2.10%), Bristol-Myers Squibb (2.05%), Johnson & Johnson (2.03%).
Dana Small Cap Equity Fund top-ten holdings as of September 30, 2018: Universal Insurance Holdings, Inc. (2.34%), Bottomline Technologies, Inc. (2.14%), Ligand Pharmaceuticals, Inc. (2.05%), Marcus Corporation (2.03%), Emergent BioSolutions Inc. (2.00%), Primerica, Inc. (1.99%), Boot Barn Holdings, Inc. (1.98%), BioTelemetry Inc. (1.87%), Chefs' Warehouse, Inc (1.83%), Comfort Systems USA, Inc. (1.83%).
Price/Earnings (P/E) is the price of a stock divided by its earnings per share.